
Prommetrix can obtain relevant information from the instances of 'Node Exporter' executed by 'Prometheus'. https://03c8.net
 psy
edd7feef22
more scraping fixes
psy
edd7feef22
more scraping fixes
|
2 лет назад | |
|---|---|---|
| docs | 2 лет назад | |
| README.md | 2 лет назад | |
| prommetrix.py | 2 лет назад |
README.md
Info:
Prommetrix is a free software tool to obtain relevant information from the instances of 'Node Exporter' executed by 'Prometheus'.
Prometheus is an open-source, metrics-based event monitoring and alerting solution for cloud applications. It is used by nearly 800 cloud-native organizations including Uber, Slack, Robinhood, and more. By scraping real-time metrics from various endpoints, Prometheus allows easy observation of a system’s state in addition to observation of hardware and software metrics such as memory usage, network usage and software-specific defined metrics (ex. number of failed login attempts to a web application).
Since the numeric metrics captured by Prometheus are not considered sensitive data, Prometheus has held an understandable policy of avoiding built-in support for security features such as authentication and encryption, in order to focus on developing the monitoring-related features. This changed less than a year ago (Jan 2021), on the release of version 2.24.0 where Transport Layer Security (TLS) and basic authentication support were introduced.
Due to the fact that authentication and encryption support is relatively new, many organizations that use Prometheus haven’t yet enabled these features and thus many Prometheus endpoints are completely exposed to the Internet (e.g. endpoints that run earlier versions), leaking metric and label data.
This vulnerabily can be described in a Pentest/Report like:
- PRM-01-001 Client: Clients leak Metrics data through unprotected endpoint (LOW)
"Metric data are to be collected for some services and these items need to implement a client-library that enables the core Prometheus service to scrape the data. The client- library opens a minimal HTTP server and exposes a route which is then registered with the core service for scraping. This endpoint is unauthenticated by default, which allows anybody who knows the URI to read the metric data. It is recommended to put some form of authentication in place. Only the core Prometheus service should be allowed to read the metric data."
Dork (using default port):
- inurl:":9100/metrics"
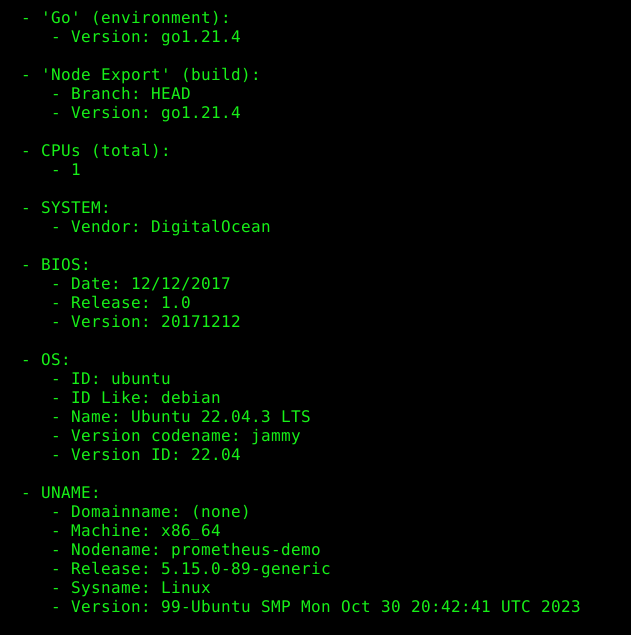
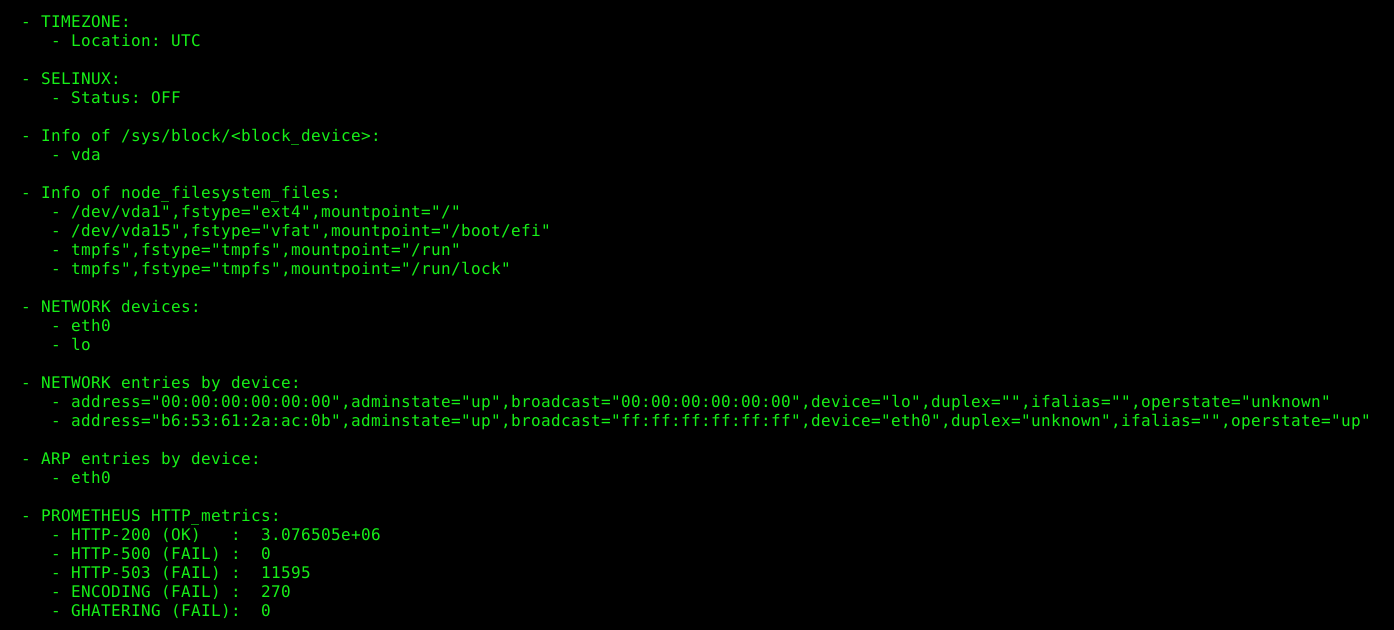
Prommetrix - will take advantage of these metrics to obtain relevant information from the Prometheus instance, as well as, of the machine in which it is running.
Installing:
This tool runs on many platforms and it requires Python (3.x.y).
Launching:
python prommetrix.py (or python3 prommetrix.py)
License:
Prommetrix is released under the GPLv3.
Contact:
- psy (epsylon@riseup.net)
Contribute:
To make donations use the following hash:
- Bitcoin: 19aXfJtoYJUoXEZtjNwsah2JKN9CK5Pcjw